Datoteka:MilankovitchCyclesOrbitandCores.png

|
This graph image could be re-created using vector graphics as an SVG file. This has several advantages; see Commons:Media for cleanup for more information. If an SVG form of this image is available, please upload it and afterwards replace this template with
{{vector version available|new image name}}.It is recommended to name the SVG file “MilankovitchCyclesOrbitandCores.svg”—then the template Vector version available (or Vva) does not need the new image name parameter. |
Sažetak
| Opis |
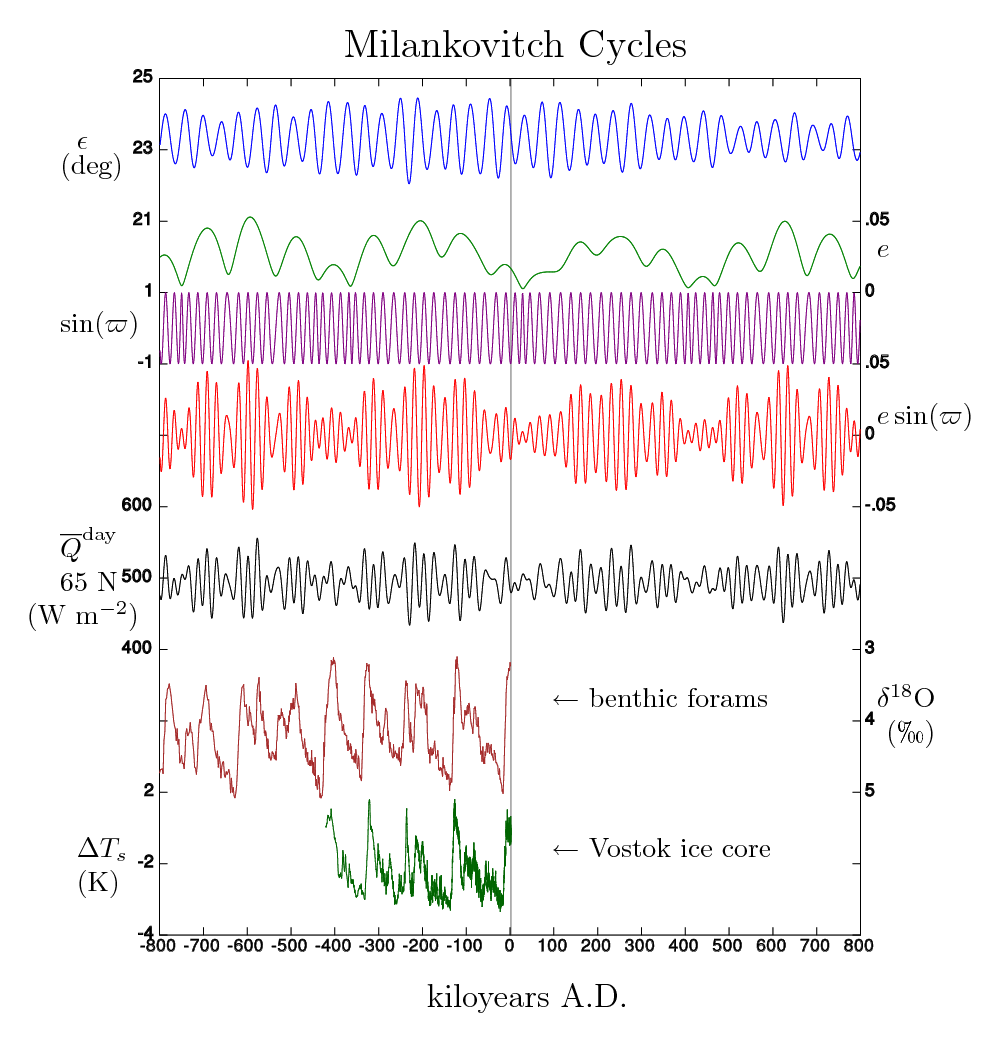
English: Orbital Parameters for the Earth:
http://aom.giss.nasa.gov/srorbpar.html Insolation calculation is generated from the orbital parameters Vostok ice core data:
Vostok Ice Core Data for 420,000 Years, IGBP PAGES/World Data Center for Paleoclimatology Data Contribution Series #2001-076. NOAA/NGDC Paleoclimatology Program, Boulder CO, USA. ftp://ftp.ncdc.noaa.gov/pub/data/paleo/icecore/antarctica/vostok/deutnat.txt Temperature reconstruction is offered within the dataset. Benthic foram data:
Pleistocene stack of 57 globally distributed benthic d18O records, Paleoceanography,20, PA1003, doi:10.1029/2004PA001071. http://lorraine-lisiecki.com/stack.html A definitive temperature reconstruction is not offered within the data set. But from: http://lorraine-lisiecki.com/thesis_appendix.html#2-Appendix-B-The-d18O-of-Foraminifera is the statement:
|
| Datum | |
| Izvor | Vlastito djelo postavljača |
| Autor | Incredio |
| Ostale inačice |
File:MilankovitchCyclesOrbitandCores.png File:MilankovitchCyclesOrbitandCoresRecaptioned.png, File:MilankovitchCyclesOrbitandCoresRecaptioned-sr.png File:Milankovic.jpg, File:Milankovic-sr.jpg |
Licencija
- Slobodno smijete:
- dijeliti – umnožavati, distribuirati i javnosti priopćavati djelo
- remiksirati – prerađivati djelo
- Pod sljedećim uvjetima:
- imenovanje autora – Morate pripisati odgovarajuće autorske zasluge, dati poveznicu na licenciju, te naznačiti jesu li načinjene promjene autorskog djela. Prethodno navedeno možete učiniti na svaki razuman način, ali ne na način koji bi sugerirao da Vi ili Vaše korištenje licencorova djela ima izravno licencorovo odobrenje.
Povijest datoteke
Kliknite na datum/vrijeme kako biste vidjeli datoteku kakva je tada bila.
| Datum/Vrijeme | Minijatura | Dimenzije | Suradnik | Komentar | |
|---|---|---|---|---|---|
| sadašnja | 03:07, 20. veljače 2025. | | 3000 × 3133 (781 KB) | wikimediacommons>Incredio | Not SVG yet, but much higher resolution PNG |
Uporaba datoteke
Sljedeća stranica rabi ovu datoteku: